Should You Worry About Markets at Record Highs in Q4
 | |||
Q4 2025 Market Update: Managing Mixed Economic IndicatorsOctober 13, 2025 | |||
Market volatility is an inherent aspect of investing, and 2025 has certainly demonstrated this reality. Downturns, including those sparked by trade policy concerns, may cause discomfort but often present chances to purchase assets at better prices. Conversely, when markets rebound and hit new peaks, investors might feel anxious despite solid fundamentals. In either case, maintaining portfolios designed to navigate all market conditions while staying aligned with long-term objectives becomes increasingly critical.
As the year's fourth quarter commences, investors confront contradictory indicators. During Q3, the S&P 500 achieved fresh record highs, propelled by robust corporate profits and excitement surrounding artificial intelligence. Simultaneously, labor market conditions have deteriorated noticeably since summer started, prompting worries about economic strength and consumer finances. Nevertheless, GDP expansion has remained solid, and inflation has generally remained contained.
Such market conditions highlight why long-term investment strategies and financial planning prove valuable. Instead of responding to news cycles and economic data releases, maintaining well-designed portfolios capable of adapting to market changes proves more beneficial. This approach demands comprehension of the fundamental trends likely to influence markets during upcoming quarters.
Primary Market and Economic Factors in Q3
Market valuations approach historically elevated territory
For investors focused on the long term, overall market valuation levels represent a crucial consideration. Rather than concentrating solely on market prices, valuations indicate what investors receive for those prices regarding earnings, cash flow, sales, dividends, and other fundamental metrics. While elevated valuations reflect investor optimism, they also suggest expectations may be excessive in certain market segments.
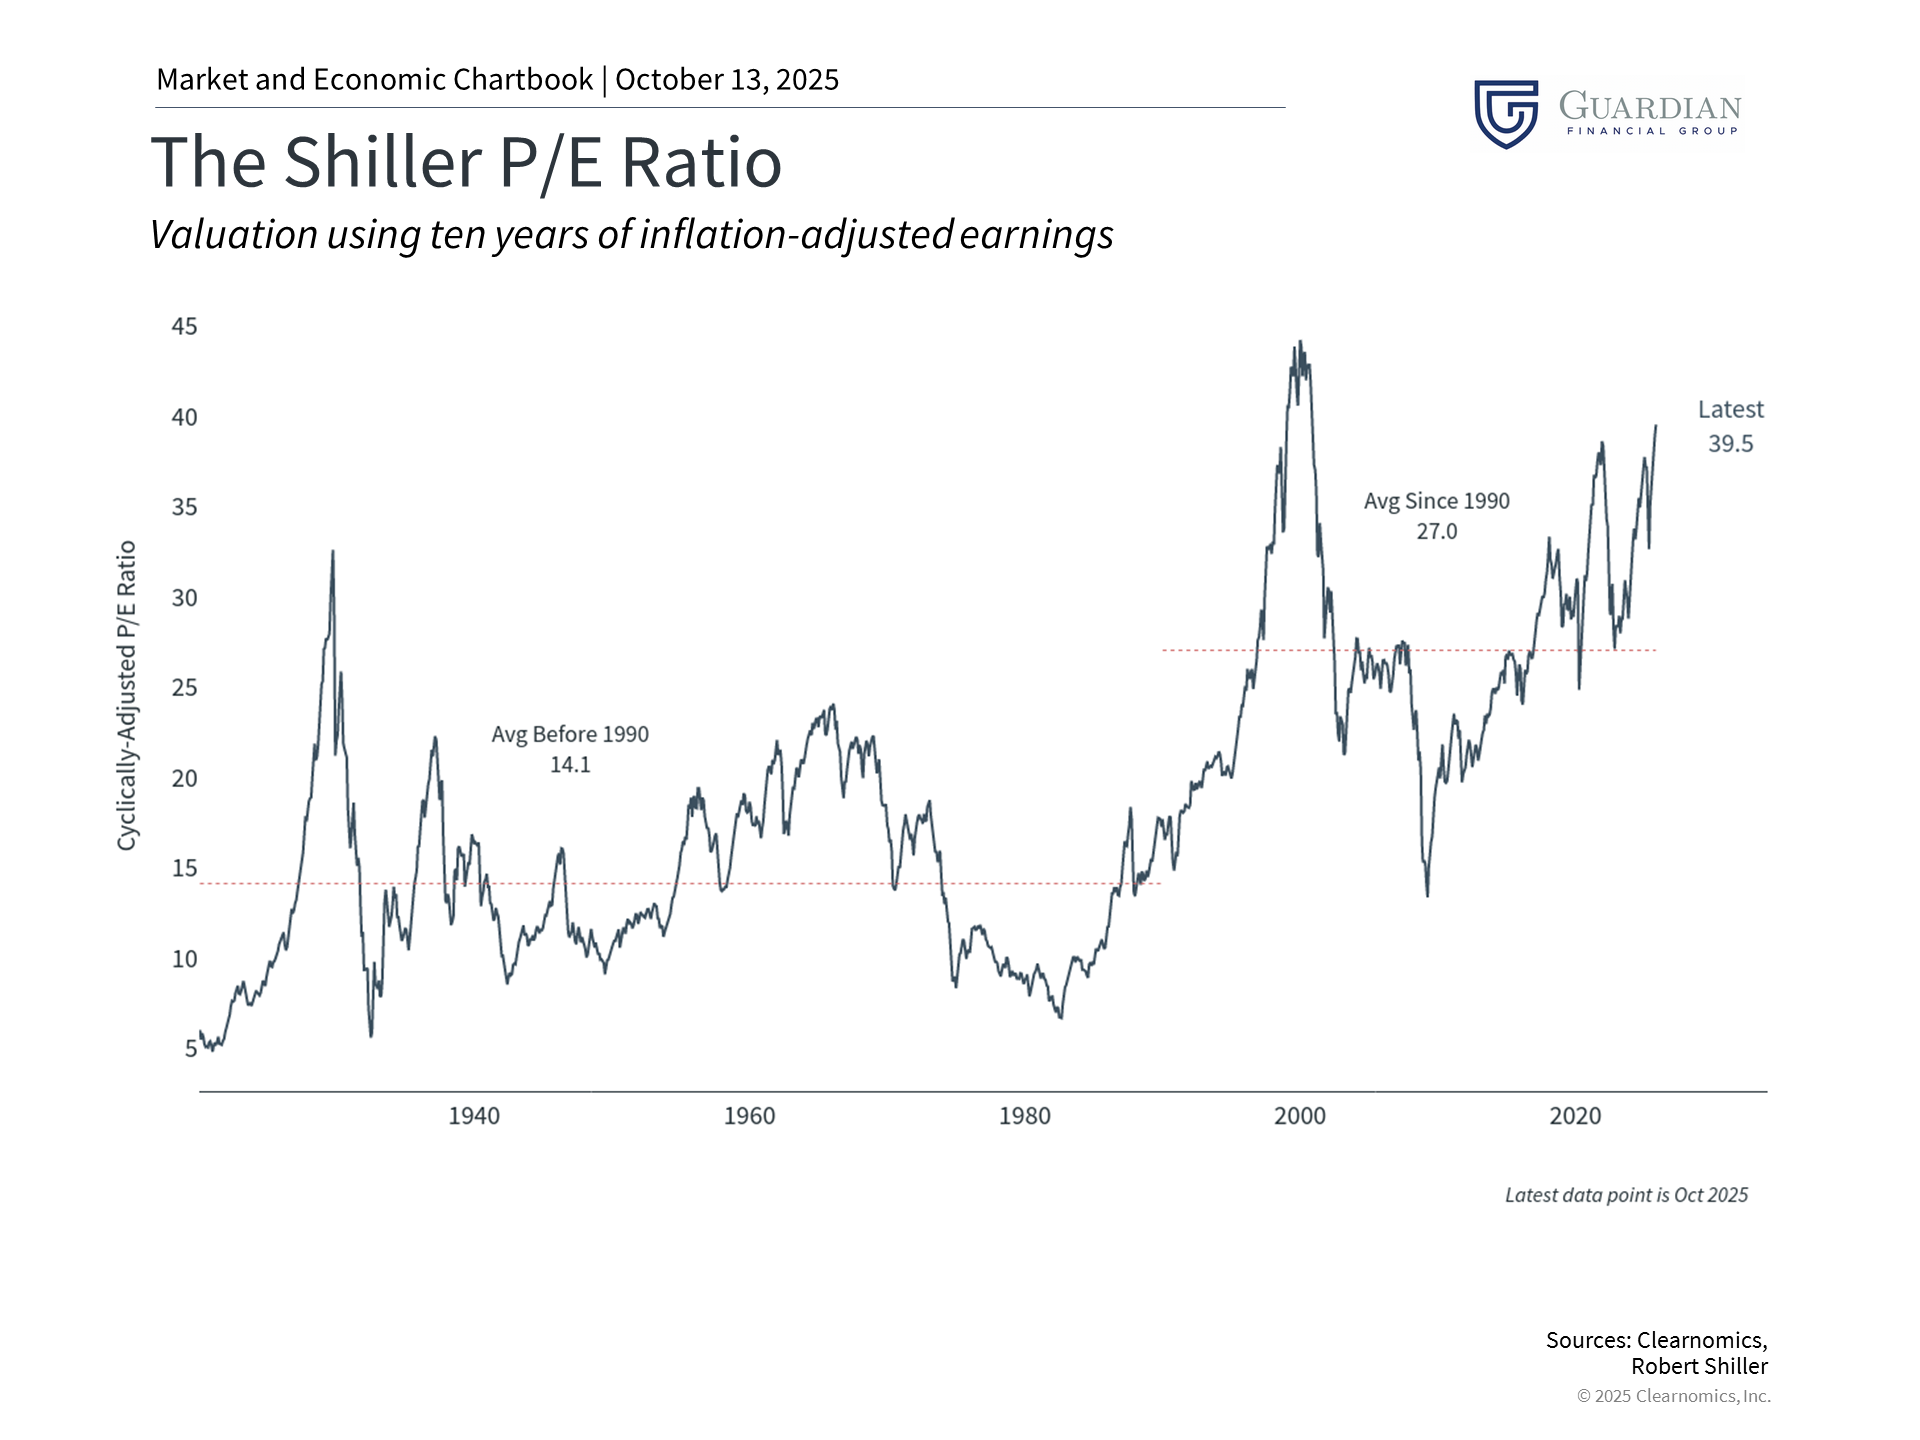
The chart illustrates this concept using the Shiller price-to-earnings ratio for the S&P 500. The current reading of 38x substantially exceeds the 35-year average of 27x and nears levels witnessed during the dot-com era. This metric offers a longer-term view than traditional P/E ratios by incorporating ten years of inflation-adjusted earnings.
That valuations have reached these heights shouldn't surprise anyone given the powerful rally over the past two quarters. Since April 8, the S&P 500 has surged 34%, producing double-digit annual gains. Technology shares across multiple sectors have spearheaded the advance, just as they led the decline. The Magnificent 7 stocks, for example, have jumped 61% from the bottom. Although investors increasingly debate whether corporate artificial intelligence expenditures will yield positive returns, this has undeniably been a primary catalyst for the broader market and business capital spending.
It's worth emphasizing that valuations don't forecast near-term market direction and shouldn't be employed as timing mechanisms. Rather, they function as essential inputs for asset allocation decisions. While overall market valuations are elevated, this doesn't apply uniformly across all market segments. For instance, small-caps, value stocks, and international equities currently present more compelling valuations compared to large-caps, growth stocks, and U.S. equities. This creates potential opportunities for investors with broader perspectives and extended time horizons.
Fed reduces rates as employment conditions soften
In September 2025, the Federal Reserve lowered interest rates by 0.25%, resuming its easing approach after maintaining steady rates for much of the year. This move represents the Fed's effort to balance persistent inflation above the 2% objective with deteriorating labor market conditions. Markets widely anticipated this rate reduction, which has provided support in recent months.
Multiple factors distinguish this easing cycle. Historically, the Fed has reduced rates responding to economic crises or recessions. While some weakness exists today, overall economic expansion remains healthy. Therefore, recent cuts represent something distinct: an effort to normalize policy following the aggressive tightening campaign that commenced in 2022. This explains why the Fed is easing policy despite continued economic expansion and markets trading at record levels.
The deteriorating job market has perhaps been the most significant factor influencing the Fed's actions. Although the unemployment rate of 4.3% remains historically low, job creation has decelerated sharply. August witnessed merely 22,000 new payroll additions, considerably below the 123,000 average from earlier this year.
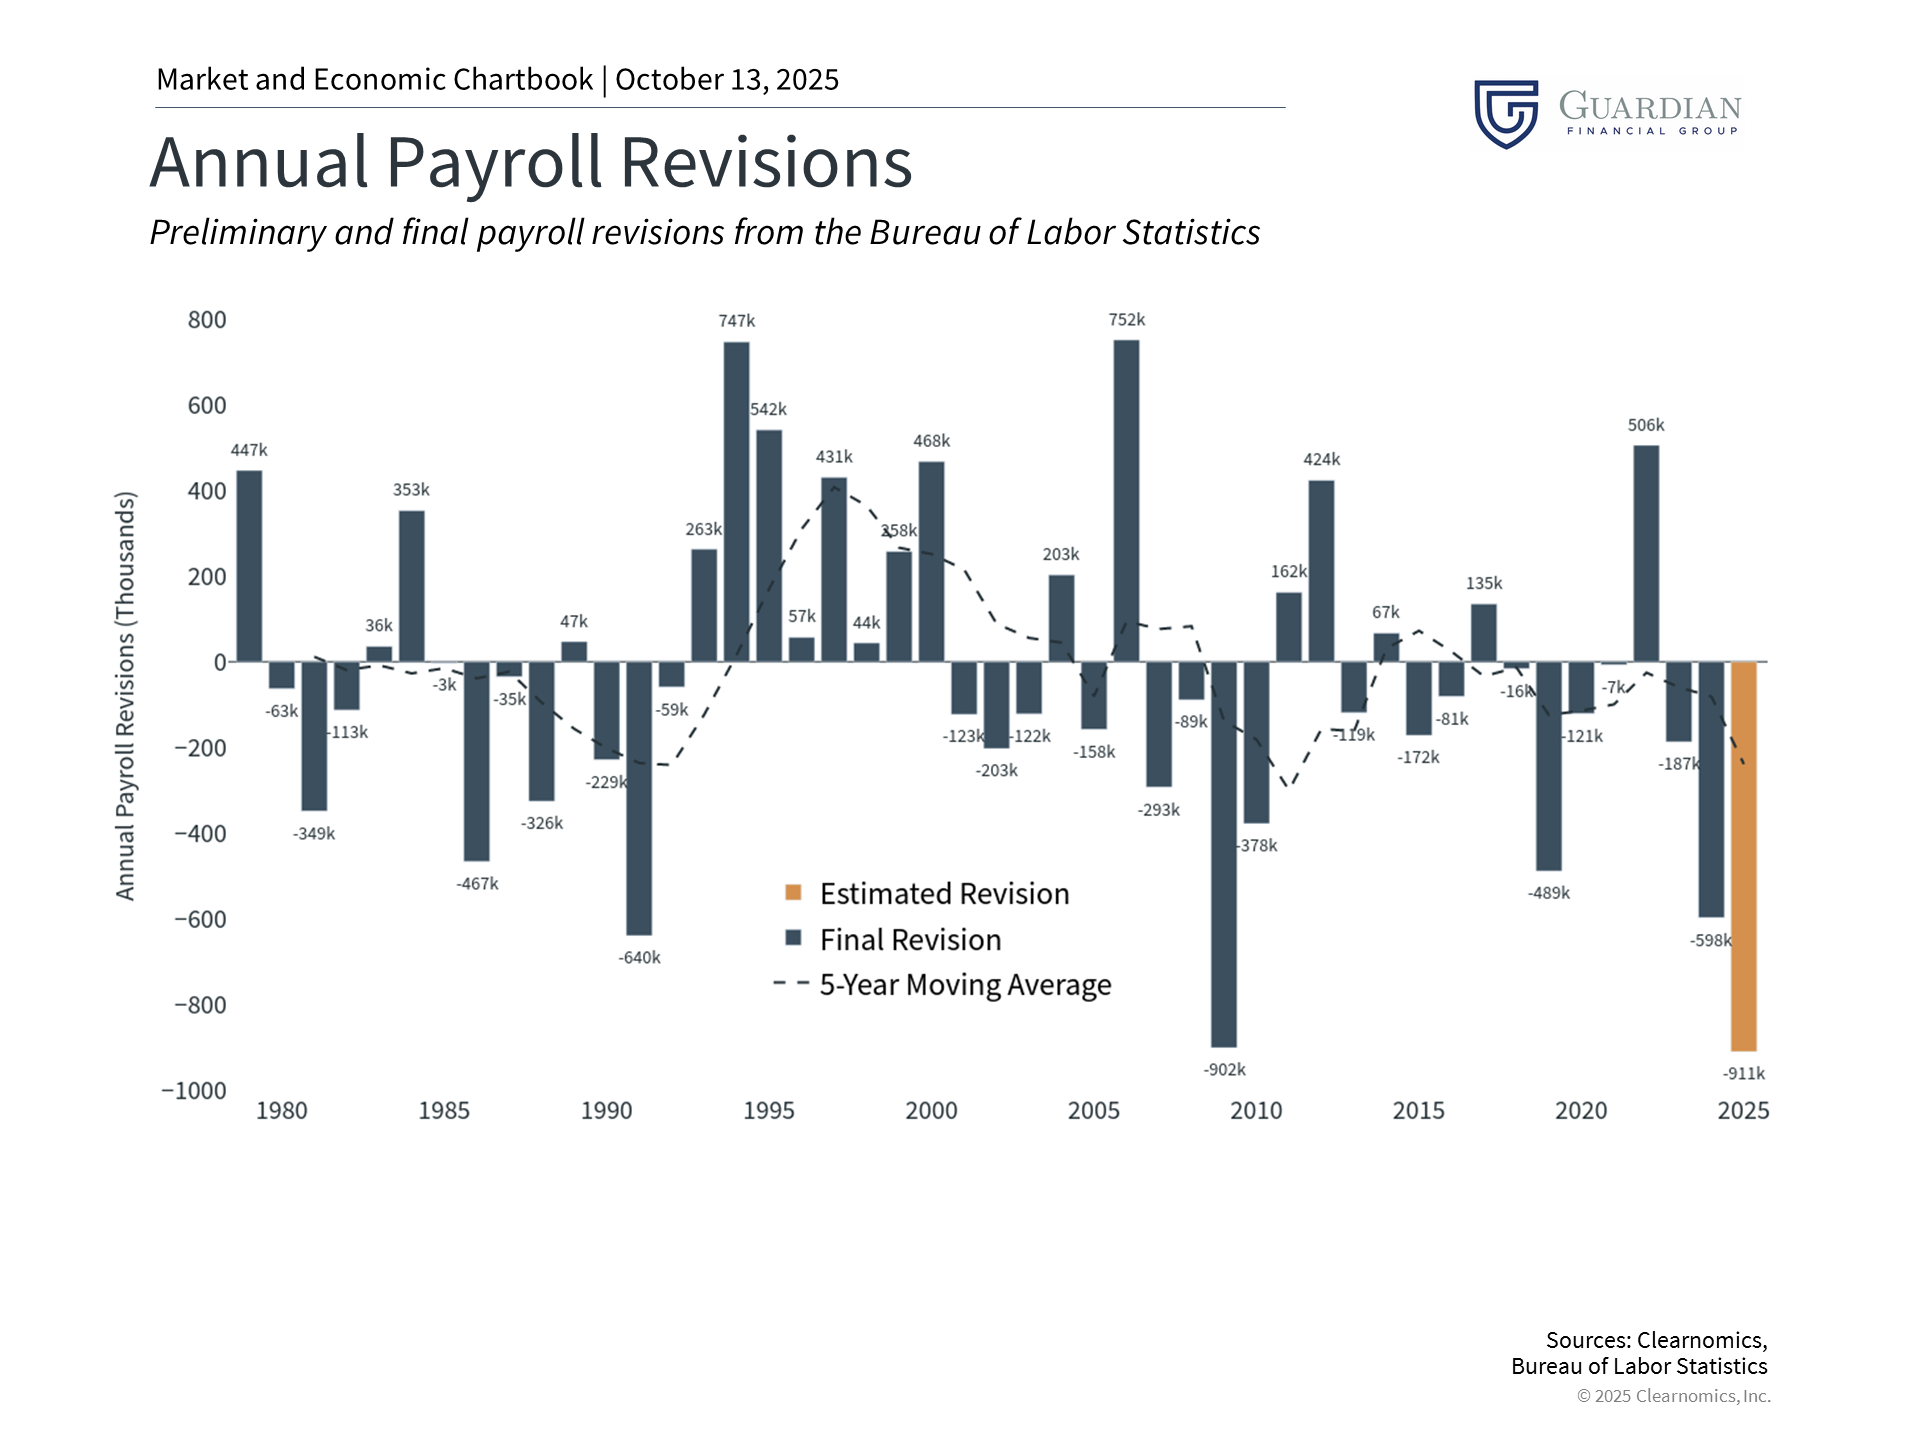
More noteworthy are payroll revisions indicating that 911,000 fewer jobs were generated during the twelve months through March than initially reported, as the chart demonstrates. The Bureau of Labor Statistics annually revises payroll figures using more precise data than available during initial monthly reports. While these numbers remain preliminary, a revision of this scale would constitute the largest on record, revealing that labor market conditions have been weaker than previously understood.
Consequently, the Fed is reducing rates because, per the latest FOMC statement, it "judges that downside risks to employment have risen." For investors, rate reductions generally support both equity and bond markets when economic conditions remain sound.
Market turbulence and policy ambiguity have diminished temporarily
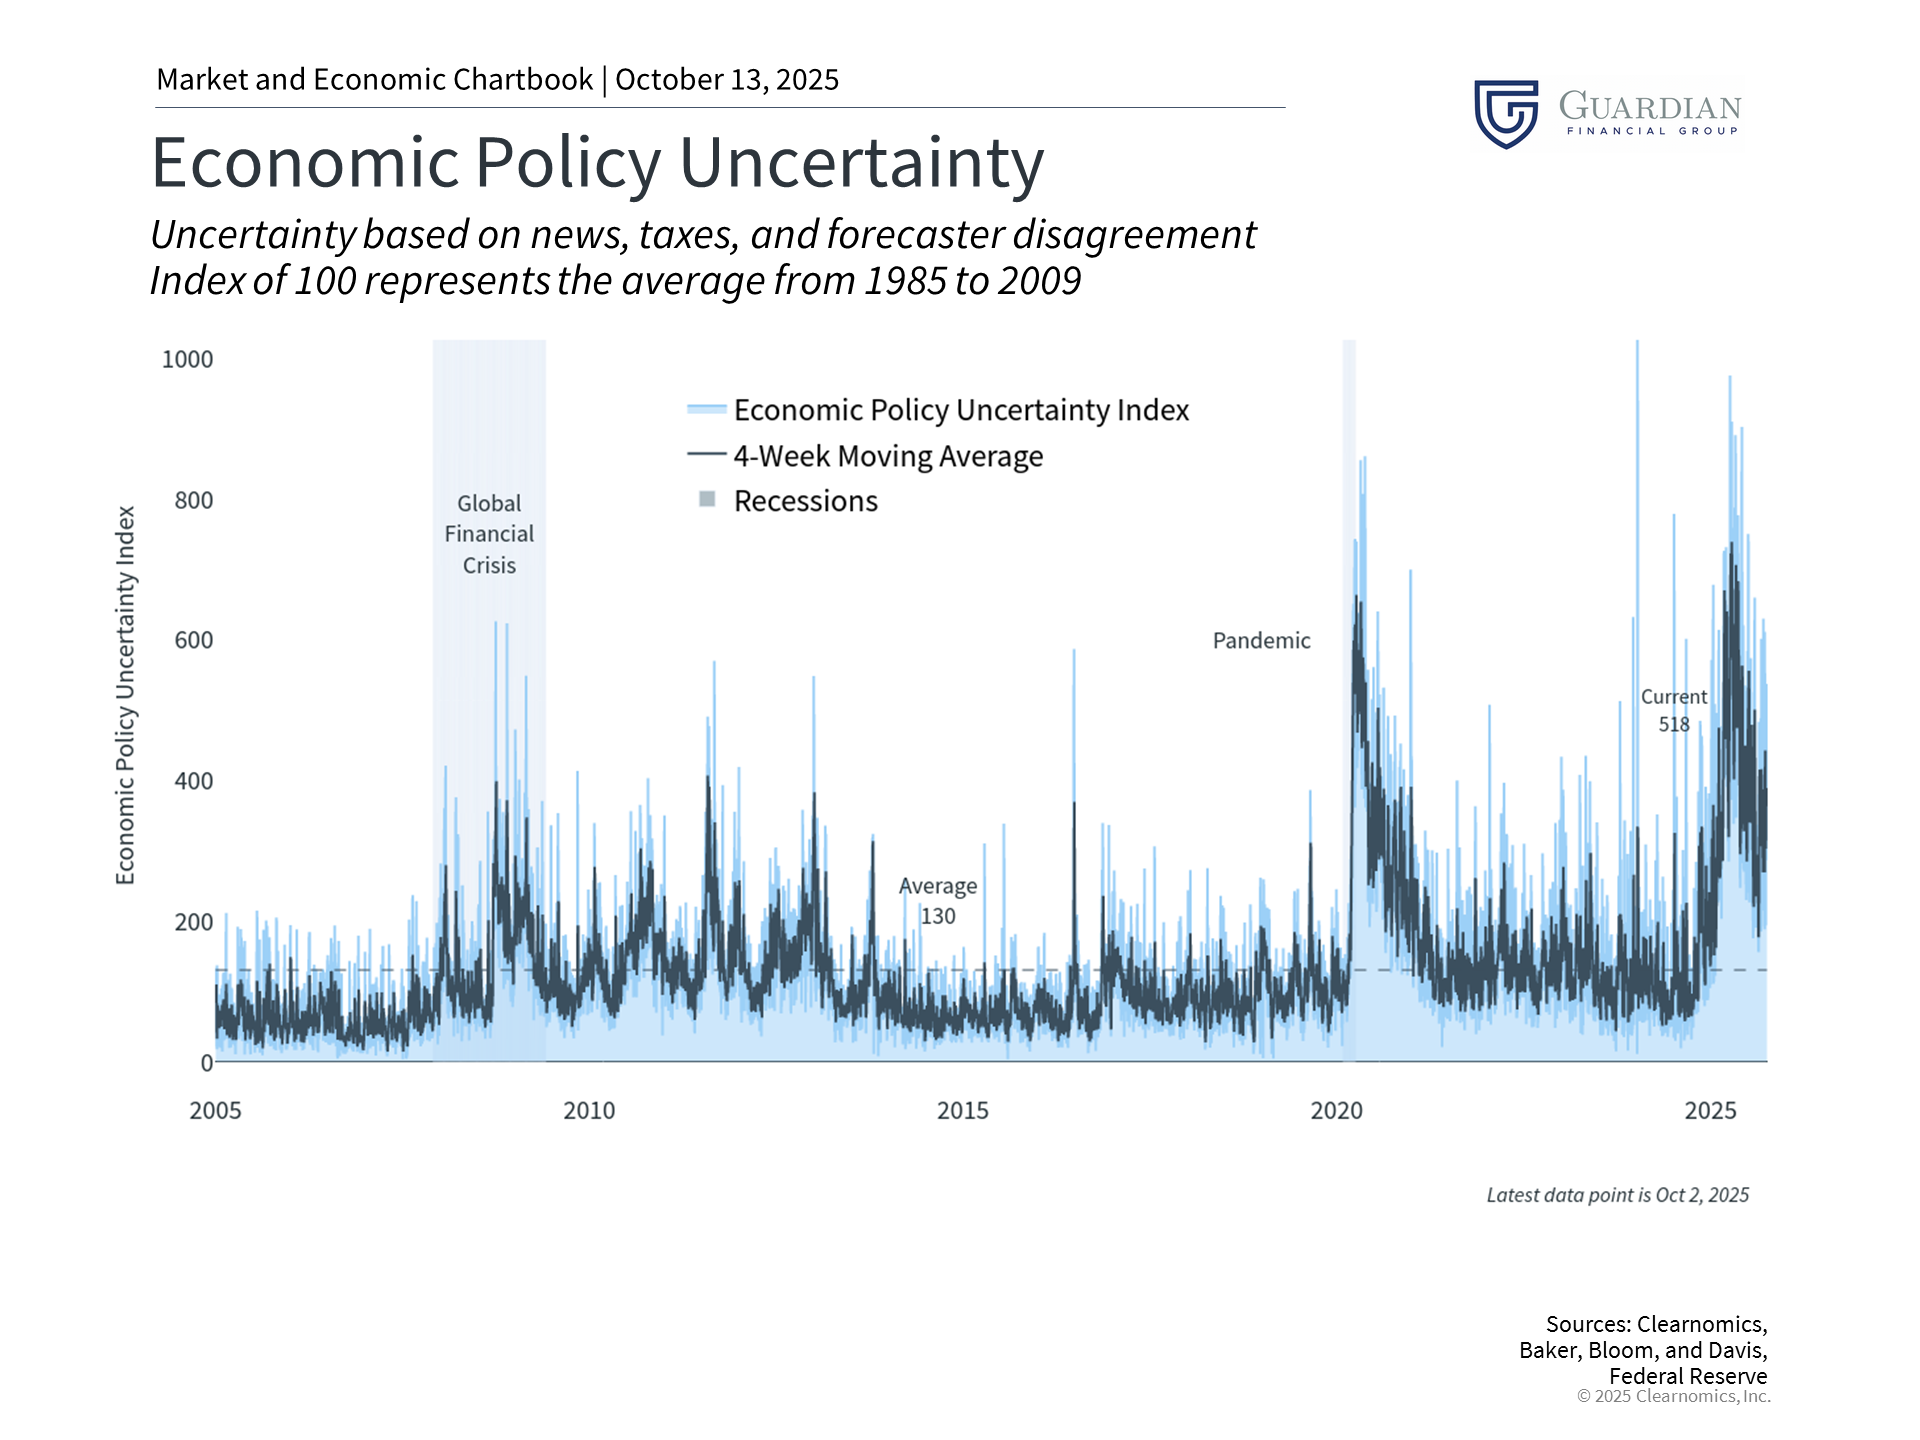
Following substantial volatility earlier this year driven by tariffs and fiscal policy, economic policy uncertainty measures have improved. The VIX index measuring stock market volatility hovers near 16.3, beneath the long-term average of 18, while the MOVE index tracking bond market volatility has decreased to 78, below the 87 average.
As many long-term investors understand, calm market periods can shift rapidly. Recent years have witnessed numerous episodes of heightened volatility stemming from inflation, trade disputes, Washington policy debates, Federal Reserve actions, recession concerns, geopolitical tensions, and more. The ongoing government shutdown represents the latest event potentially disrupting markets short-term, even if long-term impacts prove limited. Similarly, tariff policy outcomes and inflationary consequences remain uncertain.
For investors, this uncertainty may prove uncomfortable, yet it drives long-term portfolio results. Recent years also illustrate the gap between investor fears and actual market performance. Rather than treating uncertainty as something to avoid, successful long-term investors recognize it as a market characteristic creating opportunities to position portfolios for future years.
The bottom line? As Q4 begins, markets trade near record highs while confronting mixed economic signals. This environment emphasizes the necessity of maintaining suitable asset allocation and remaining focused on financial objectives. | |||
Advisory services through Cambridge Investment Research Advisors, Inc., a Registered Investment Adviser. Cambridge and Guardian Financial Group are not affiliated. Copyright (c) 2025 Clearnomics, Inc. All rights reserved. The information contained herein has been obtained from sources believed to be reliable, but is not necessarily complete and its accuracy cannot be guaranteed. No representation or warranty, express or implied, is made as to the fairness, accuracy, completeness, or correctness of the information and opinions contained herein. The views and the other information provided are subject to change without notice. All reports posted on or via www.clearnomics.com or any affiliated websites, applications, or services are issued without regard to the specific investment objectives, financial situation, or particular needs of any specific recipient and are not to be construed as a solicitation or an offer to buy or sell any securities or related financial instruments. Past performance is not necessarily a guide to future results. Company fundamentals and earnings may be mentioned occasionally, but should not be construed as a recommendation to buy, sell, or hold the company's stock. Predictions, forecasts, and estimates for any and all markets should not be construed as recommendations to buy, sell, or hold any security--including mutual funds, futures contracts, and exchange traded funds, or any similar instruments. The text, images, and other materials contained or displayed in this report are proprietary to Clearnomics, Inc. and constitute valuable intellectual property. All unauthorized reproduction or other use of material from Clearnomics, Inc. shall be deemed willful infringement(s) of this copyright and other proprietary and intellectual property rights, including but not limited to, rights of privacy. Clearnomics, Inc. expressly reserves all rights in connection with its intellectual property, including without limitation the right to block the transfer of its products and services and/or to track usage thereof, through electronic tracking technology, and all other lawful means, now known or hereafter devised. Clearnomics, Inc. reserves the right, without further notice, to pursue to the fullest extent allowed by the law any and all criminal and civil remedies for the violation of its rights.  |


